Performance Tuning&Tests for the Elasticsearch Output
Original post: Rsyslog 8.1 Elasticsearch Output Performance by @Sematext
Version 8 brings major changes in rsyslog’s core – see Rainer’s presentation about it for more details. Those changes should give outputs better performance, and the Elasticsearch one should benefit a lot. Since we’re using rsyslog and Elasticsearch in Sematext‘s own log analytics product, Logsene, we had to take the new version for a spin.
The Weapon and the Target
For testing, we used a good-old i3 laptop, with 8GB of RAM. We generated 20 million logs, sent them to rsyslog via TCP and from there to Elasticsearch in the Logstash format, so they can get explored with Kibana. The objective was to stuff as many events per second into Elasticsearch as possible.
Rsyslog Architecture Overview
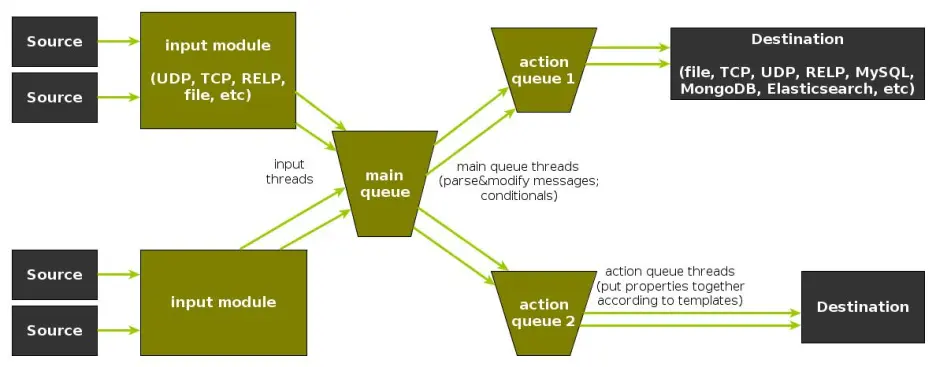
In order to tweak rsyslog effectively, one needs to understand its architecture, which is not that obvious (although there’s an ongoing effort to improve the documentation). The gist of it its architecture represented in the figure below.
- you have input modules taking messages (from files, TCP/UDP, journal, etc.) and pushing them to a main queue
- one or more main queue threads take those events and parse them. By default, they parse syslog formats (RFC-3164, RFC-5424 and various derivatives), but you can configure rsyslog to use message modifier modules to do additional parsing (e.g. CEE-formatted JSON messages). Either way, this parsing generates structured events, made out of properties
- after parsing, the main queue threads push events to the action queue. Or queues, if there are multiple actions and you want to fan-out
- for each defined action, one or more action queue threads takes properties from events according to templates, and makes messages that would be sent to the destination. In Elasticsearch’s case, a template should make Elasticsearch JSON documents, and the destination would be the REST API endpoint
There are two more things to say about rsyslog’s architecture before we move on to the actual test:
- you can have multiple independent flows (like the one in the figure above) in the same rsyslog process by using rulesets. Think of rulesets as swim-lanes. They’re useful for example when you want to process local logs and remote logs in a completely separate manner
- queues can be in-memory, on disk, or a combination called disk-assisted. Here, we’ll use in-memory because they’re the fastest. For more information about how queues work, take a look here
Configuration
To generate messages, we used tcpflood, a small and light tool that’s part of rsyslog’s testbench. It generates messages and sends them over to the local syslog via TCP.
Rsyslog took received those messages with the imtcp input module, queued them and forwarded them to Elasticsearch 0.90.7, which was also installed locally. We also tried with Elasticsearch 1.0 and got the same results (see below).
The flow of messages in this test is represented in the following figure:
The actual rsyslog config is listed below (in the new configuration format). It can be tuned further (for example by using the multithreaded imptcp input module), but we didn’t get significant improvements in this particular scenario.
module(load="imtcp")   # TCP input module
module(load="omelasticsearch") # Elasticsearch output module

input(type="imtcp" port="13514")  # where to listen for TCP messages

main_queue(
  queue.size="1000000"   # capacity of the main queue
  queue.dequeuebatchsize="1000"  # process messages in batches of 1000 and move them to the action queues
  queue.workerthreads="2"  # 2 threads for the main queue
)

# template to generate JSON documents for Elasticsearch in Logstash format
template(name="plain-syslog"
         type="list") {
           constant(value="{")
             constant(value="\"@timestamp\":\"")      property(name="timereported" dateFormat="rfc3339")
             constant(value="\",\"host\":\"")        property(name="hostname")
             constant(value="\",\"severity\":\"")    property(name="syslogseverity-text")
             constant(value="\",\"facility\":\"")    property(name="syslogfacility-text")
             constant(value="\",\"syslogtag\":\"")   property(name="syslogtag" format="json")
             constant(value="\",\"message\":\"")    property(name="msg" format="json")
             constant(value="\"}")
         }

action(type="omelasticsearch"
       template="plain-syslog"  # use the template defined earlier
       searchIndex="test-index"
       bulkmode="on"                   # use the Bulk API
       queue.dequeuebatchsize="5000"   # ES bulk size
       queue.size="100000"   # capacity of the action queue
       queue.workerthreads="5"   # 5 workers for the action
       action.resumeretrycount="-1"  # retry indefinitely if ES is unreachable
)
You can see from the configuration that:
- both main and action queues have a defined size in number of messages
- both have number of threads that deliver messages to the next step. The action needs more because it has to wait for Elasticsearch to reply
- moving of messages from the queues happens in batches. For the Elasticsearch output, the batch of messages is sent through the Bulk API, which makes queue.dequeuebatchsize effectively the bulk size
Results
We started with default Elasticsearch settings. Then we tuned them to leave rsyslog with a more significant slice of the CPU. We monitored the indexing rate with SPM for Elasticsearch. Here are the average results over 20 million indexed events:
- with default Elasticsearch settings, we got 8,000 events per second
- after setting Elasticsearch up more production-like (5 second refresh interval, increased index buffer size, translog thresholds, etc), and the throughput went up to average of 20,000 events per second
- in the end, we went berserk and used in-memory indices, updated the mapping to disable any storing or indexing for any field, to have Elasticsearch do as little work as possible and make room for rsyslog. Got an average of 30,000 events per second. In this scenario, rsyslog was using between 1 and 1.5 of the 4 virtual CPU cores, with tcpflood using 0.5 and Elasticsearch using from 2 to 2.5
Conclusion
20K EPS on a low-end machine with production-like configuration means Elasticsearch is quick at indexing. This is very good for logs, where you typically have lots of messages being generated, compared to how often you search.
If you need some tool to ship your logs to Elasticsearch with minimum overhead, rsyslog version 8 may well be your best bet.
Related posts:


